Visualizer Reference
Nokkvi features a custom-built, GPU-accelerated visualizer that runs an internal FFT over Nokkvi’s own audio output and renders it with WGSL shaders. This reference explains the modes, effects, and color-mapping strategies available in config.toml.
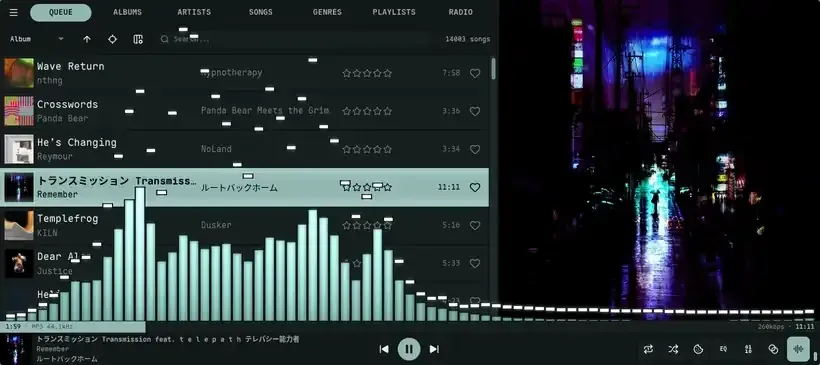
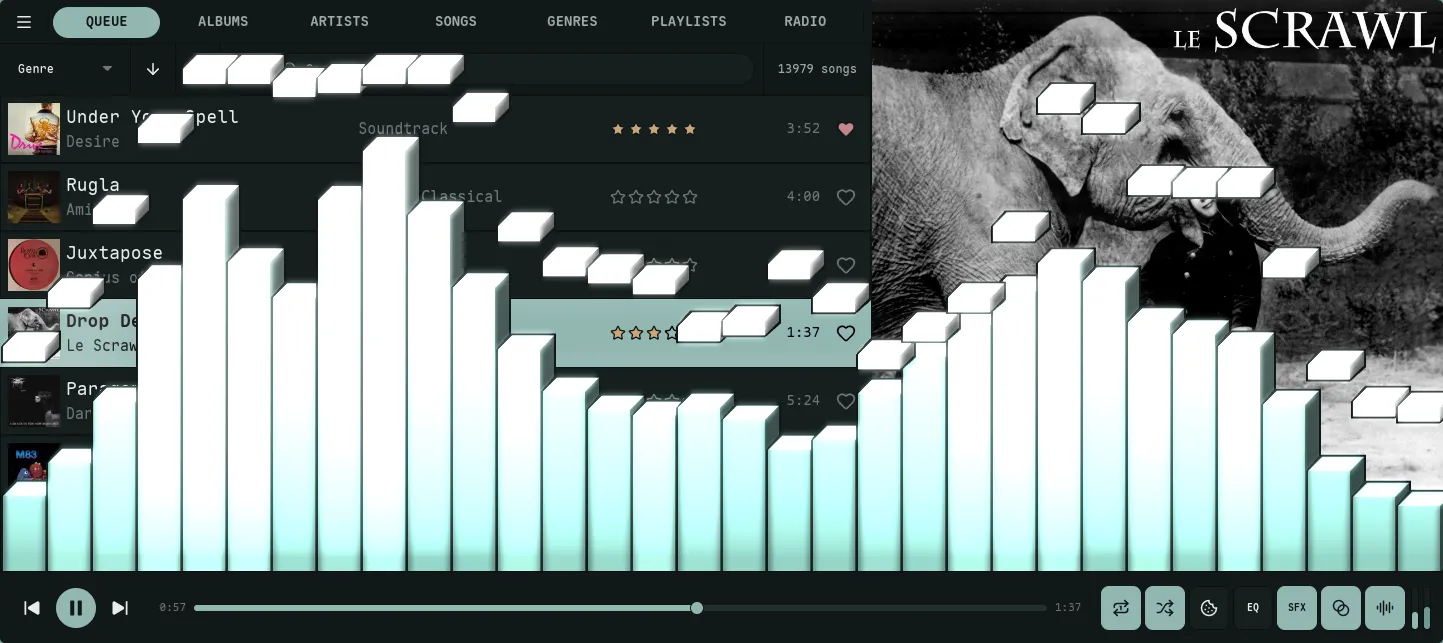
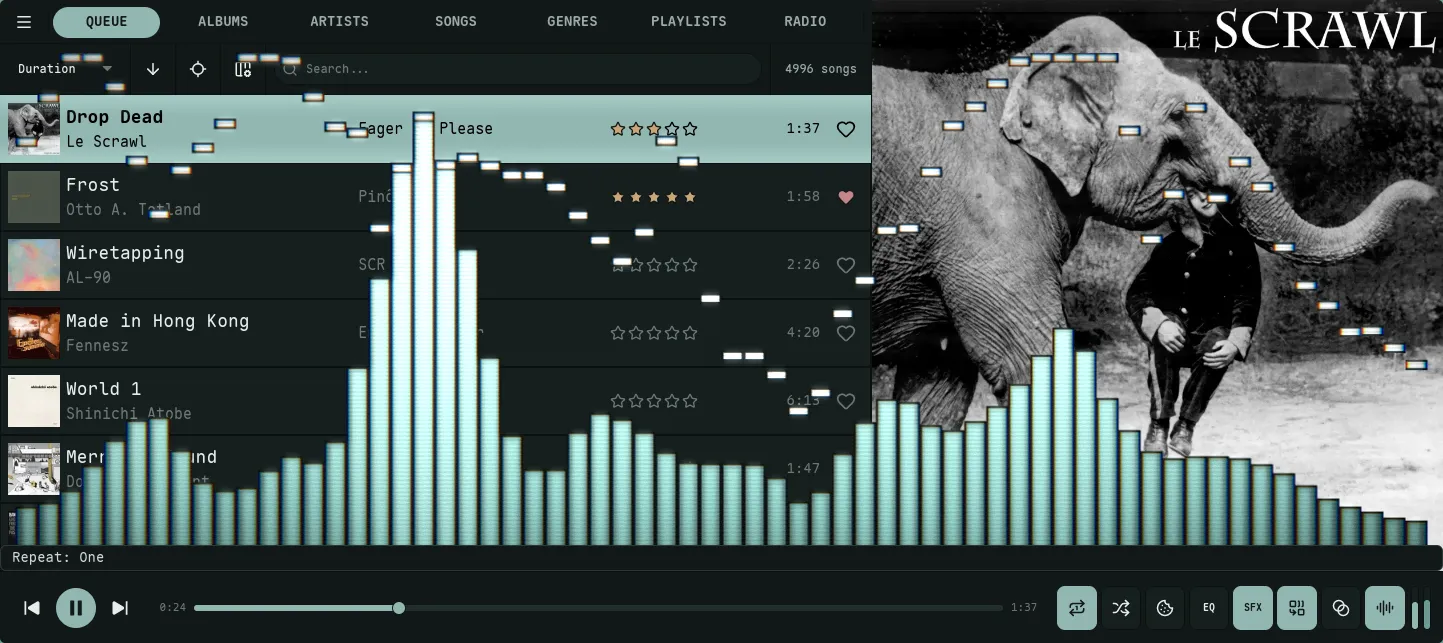
Frequency data rendered as vertical columns with optional peak indicators.
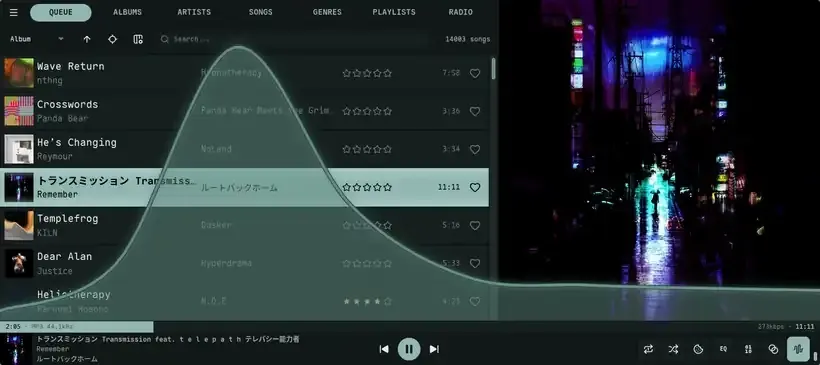
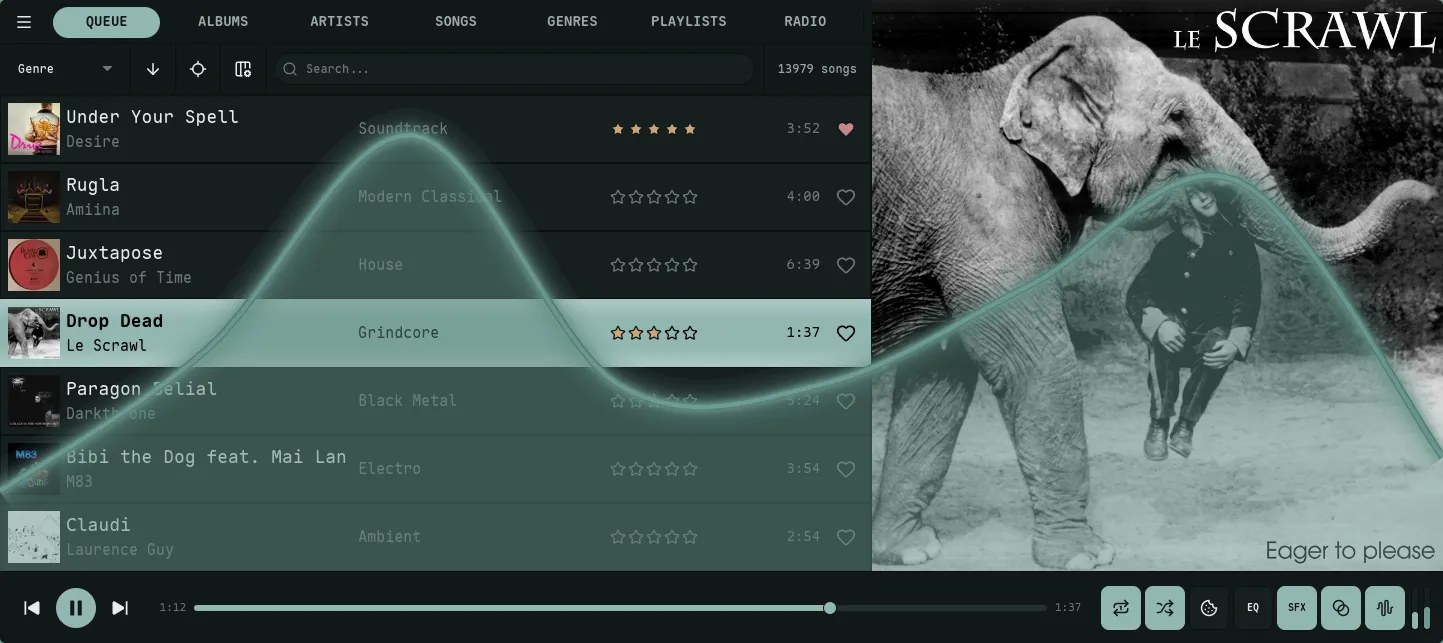
Frequency data rendered as a continuous path, oscilloscope-style. The surfing boat overlay is optional.
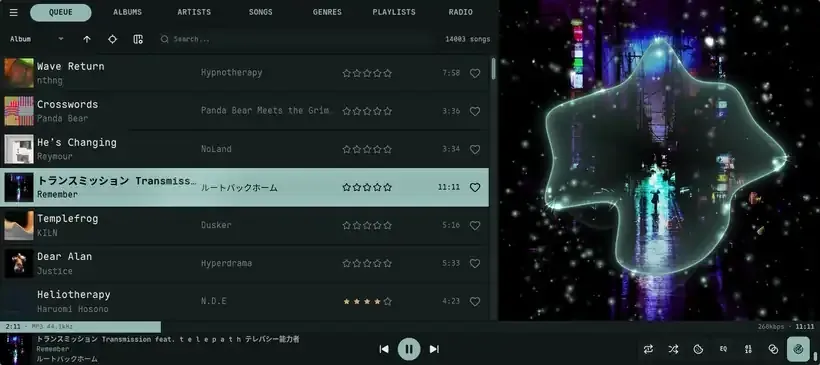
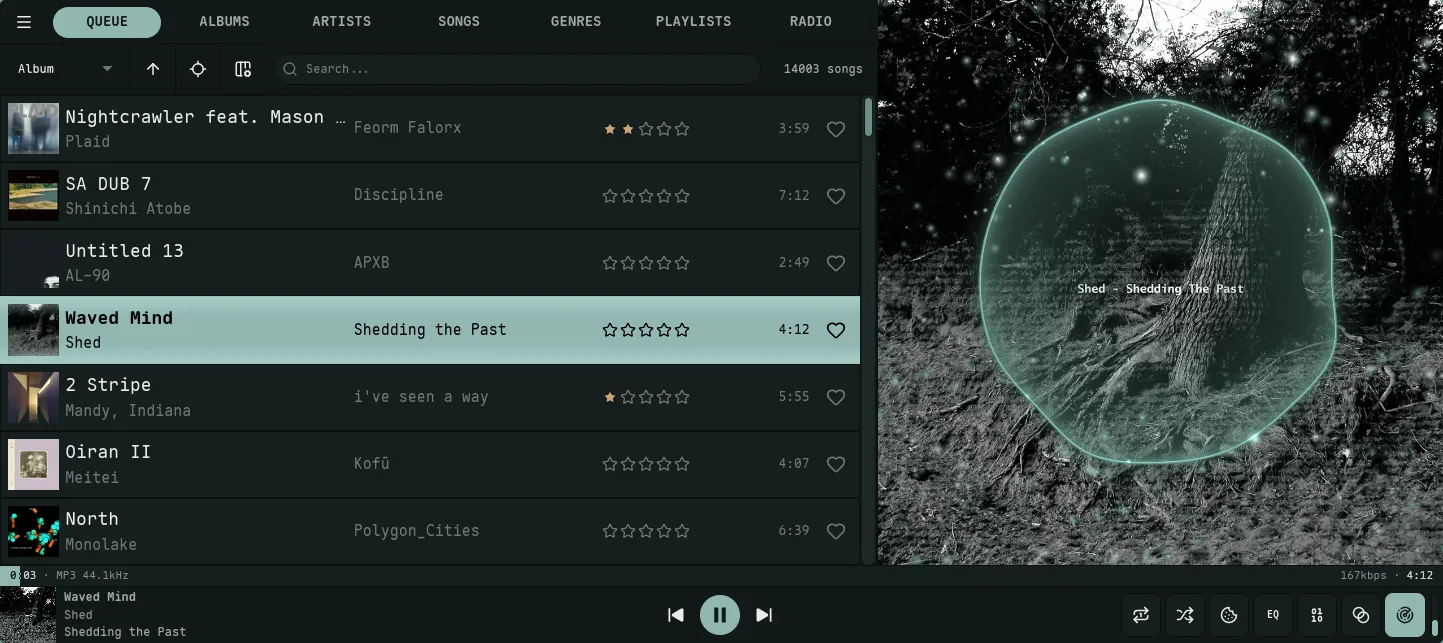
A circular oscilloscope (time-domain waveform ring) drawn over the now-playing cover art, with an optional glowing particle field.
Bars Mode
Section titled “Bars Mode”The bars mode renders frequency data as vertical columns. It is highly configurable with various gradient and peak behaviors.
Gradient Modes
Section titled “Gradient Modes”Controls how colors from your theme’s palette are mapped onto the bars.
| Mode | Description |
|---|---|
static | Static Height. The gradient is pinned to the visualizer; bars reveal higher colors as they rise. |
wave (default) | Stretched Gradient. Each bar’s gradient is stretched by its amplitude, redistributing the palette as the bar rises and falls. |
Orientation
Section titled “Orientation”Determines the axis along which gradient colors are applied.
vertical: Colors map from the bottom of the visualizer to the top.horizontal: Colors map from the low frequencies (left) to high frequencies (right).
Peak Behavior
Section titled “Peak Behavior”Peaks are small indicators that mark the highest point reached by a bar.
| Mode | Description |
|---|---|
none | Peaks are disabled. |
fade | Peaks hold for a duration, then fade out in their current position. |
fall | Peaks hold, then drop at a constant velocity. |
fall_accel | Peaks hold, then fall with simulated gravity (acceleration). |
fall_fade | Peaks fall at a constant velocity while simultaneously fading out. |
Peak Gradient Modes
Section titled “Peak Gradient Modes”Controls the coloring of the peak indicators.
static: Uses only the first color defined inpeak_gradient_colors.cycle: Smoothly cycles through all peak colors over time (breathing effect).height: Color is determined by the peak’s vertical position.match: The peak always matches the color of the bar at that specific height.
Peak Flash
Section titled “Peak Flash”visualizer.bars.flash_intensity (default 0.6, range 0.0–1.0; 0 disables). When a bar spikes on a transient or beat, its body blooms toward the first peak color. The flash spreads to a few neighbouring bars and decays. This is separate from the peak indicator and from the global Bloom Glow.
LED Mode
Section titled “LED Mode”visualizer.bars.led_bars (default false) renders each bar as a stack of LED/VU-meter segments. led_segment_height sets the segment height, and border_width doubles as the gap between segments. In LED mode the peak indicator is exactly one segment tall, so peak_height_ratio is ignored.
Isometric Depth
Section titled “Isometric Depth”visualizer.bars.bar_depth_3d (default 0, off) extrudes each bar with shaded top and side faces for an isometric 3D look. Higher values deepen the extrusion (up to 20 px).
Lines Mode
Section titled “Lines Mode”The lines mode renders frequency data as a continuous path (oscilloscope style).
smooth: Uses Catmull-Rom spline interpolation for a liquid, organic look.angular: Uses direct point-to-point lines for a sharper, technical look.
Gradient Modes
Section titled “Gradient Modes”| Mode | Description |
|---|---|
breathing | The entire line cycles through the palette over time. |
static (default) | The line stays a single solid color (the first in the palette). |
position | Colors are mapped from left (bass) to right (treble). |
height | Colors are mapped based on amplitude (quiet = bottom colors, loud = top colors). |
gradient | A blend of horizontal position and amplitude — peaks shift the palette further along, mixing the position and height mappings 50/50. |
visualizer.lines.glow_intensity (default 0.5, range 0.0–1.0). A neon emissive halo drawn beyond the main stroke — over the dark backdrop it reads as a tube of light. The halo widens (≈3–10 px) with intensity, brightens with overall loudness, and flares on each beat. The dark outline never glows, so it stays crisp. 0 disables it.
Fill & Mirror
Section titled “Fill & Mirror”- Fill.
visualizer.lines.fill_opacity(default0.5) shades the area under the curve with the gradient. - Mirror.
visualizer.lines.mirror(defaultfalse) draws the waveform symmetrically from the centre, oscilloscope-style.
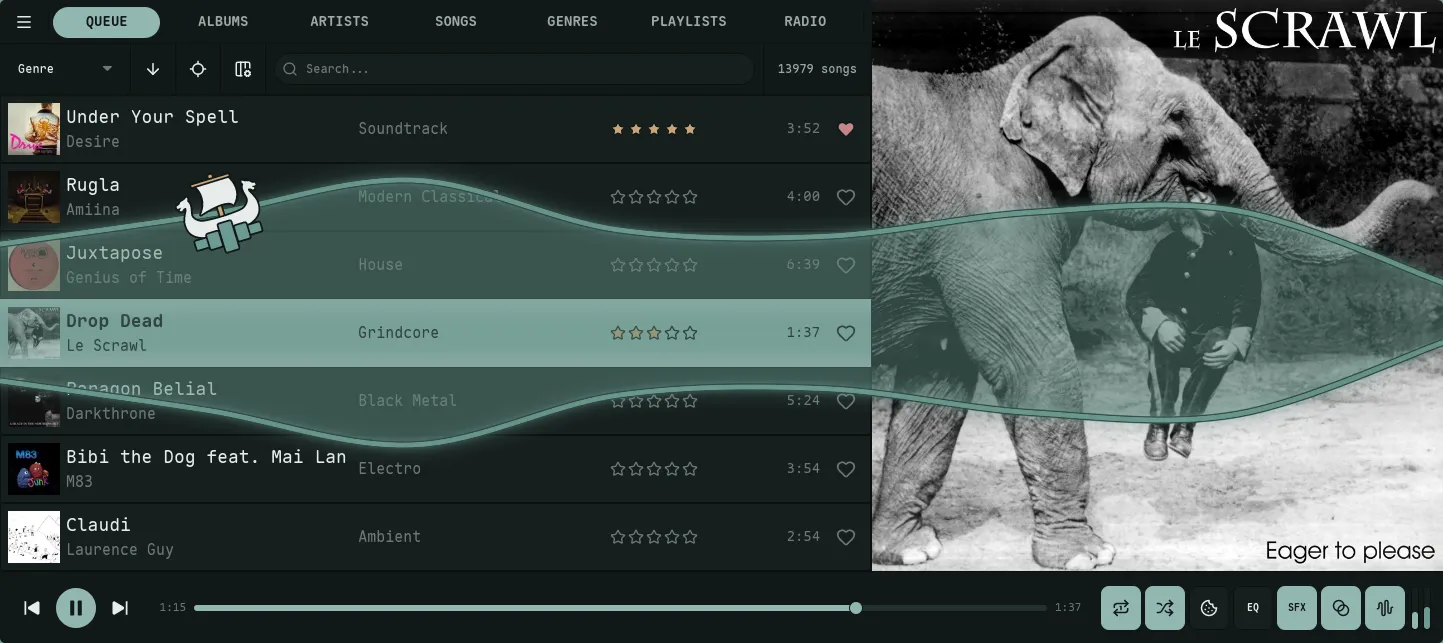
Surfing Boat
Section titled “Surfing Boat”On by default for lines mode: a small boat rides the waveform. Set visualizer.lines.boat = false in config.toml, or toggle it under Settings → Visualizer → Lines, to turn it off.
- Cruise speed is driven by tagged BPM, onset energy, a slow energy envelope, and spectral presence. Top speed scales with the full energy stack, so denser tracks read faster; silence brings the boat to rest.
- Rowing. A beat-locked half-sine envelope adds gentle thrust pulses when BPM is tagged.
- Tacks ramp sail thrust from zero back to full over 4 seconds.
- Slope tilts the boat to match the local wave (spring-damped, capped near 17°). Slope force only resists motion, never assists.
- Heading. The sprite mirrors horizontally so the sail catches wind from behind.
- Edge wrap preserves momentum; the boat sails fully off one edge (through an off-screen margin) before reappearing on the opposite side — it is drawn as a single sprite, never split across the seam.
- Anchor. Every 45–120 s the boat anchors for 10–15 s, dropping a lucide-anchor icon to the visualizer floor with a curved rope back to the boat. The rope sways with the local wave; tacks pause for the duration.
- Sizing. Boat sprite clamps to 48–160 px; rope stroke 1.5–3.5 px; the anchor scales with the boat.
- Outline. The boat hull, anchor, and rope all use the theme’s dark-variant
border_color/border_opacity, so they stay solid in light mode even when the wave’s own outline fades. The boat outline is independent of the wave’soutline_thickness/outline_opacity; only aborder_opacityof0hides it. - Pause vs silence. Freezes when audio is paused; sinks to the floor during silence while playing.
Scope Mode
Section titled “Scope Mode”The scope mode draws a circular oscilloscope — a time-domain waveform ring — over the now-playing cover art. It is cycled after Lines with the V hotkey, or set visualization_mode = "scope". The ring reuses the Lines gradient modes and style options, and adds geometry and particle controls of its own.
Ring Geometry
Section titled “Ring Geometry”- Radius.
visualizer.scope.radius(default0.7) sets the ring’s mean radius as a fraction of the space inside the cover —0.1is a tiny inner ring,0.95nearly fills the panel. - Sensitivity.
visualizer.scope.sensitivity(default1.5) is the waveform swing: how far loud audio pushes the ring in and out (0.5subtle,5.0wild). - Point count.
visualizer.scope.point_count(default16) sets how many points trace the ring — low values give a chunky, blobby ring; high values resolve fine waveform detail. - Thickness.
visualizer.scope.line_thickness(default0.01) is the ring stroke as a fraction of the panel.
Ring Look
Section titled “Ring Look”- Fill.
visualizer.scope.fill_opacity(default0.5) shades a radial gradient from the ring toward the centre. - Glow.
visualizer.scope.glow_intensity(default0.35) wraps the ring in a neon halo, like the Lines glow. - Beam.
visualizer.scope.beam(defaulttrue) renders the ring with additive blending so overlapping glow accumulates into a bright neon beam (woscope-style). - Outline.
visualizer.scope.outline_thickness/outline_opacity(default off) draw a darker border behind the ring for contrast on busy covers.
Particles
Section titled “Particles”visualizer.scope.particles (default true) launches a glowing particle field that drifts outward from the ring on the beat — the NCS / Wav2Bar look. particle_count (default 192, up to 2048) sets how many, and particle_speed (default 0.5) how fast they fly out (0.1 lazy drift, 4.0 energetic).
Placement
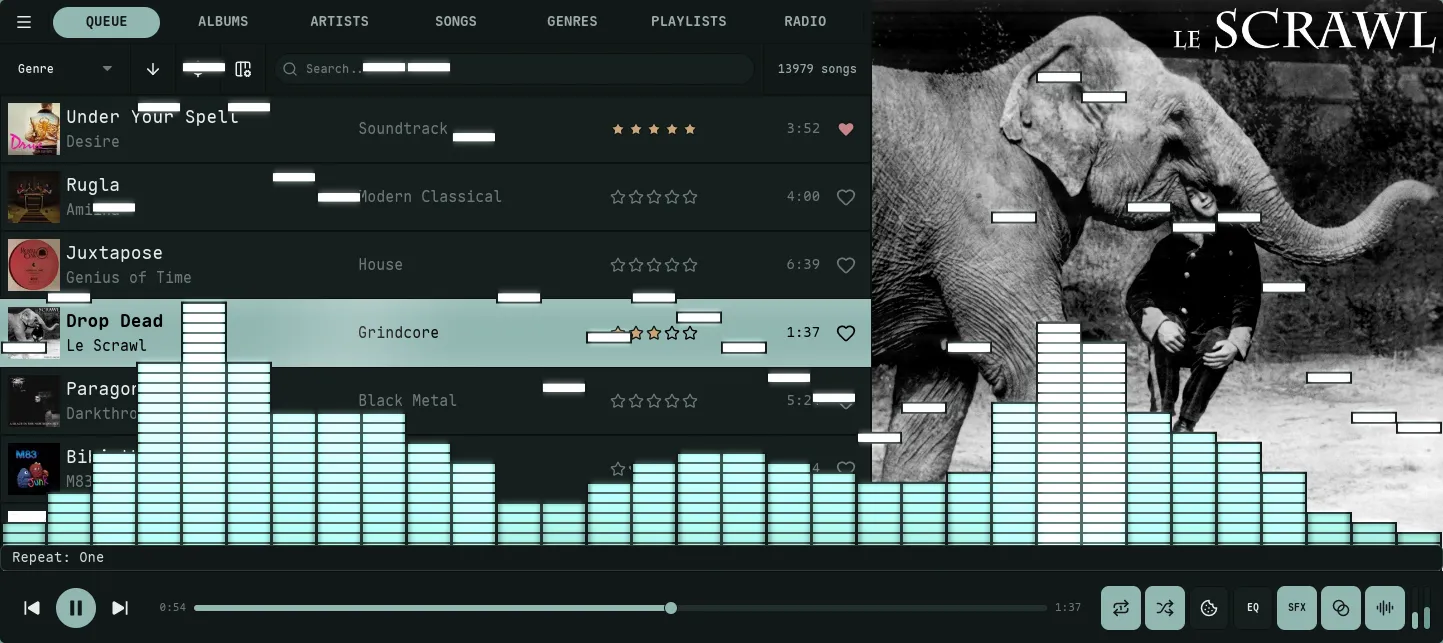
Section titled “Placement”Bars and Lines can be drawn in one of two places, set per mode via visualizer.bars.placement and visualizer.lines.placement:
over_cover(default) — over the now-playing cover art in the Queue view, and only while audio is playing. The integrated cover look greets you on the default Queue view.bottom_band— the classic placement: a band across the bottom of the window, above the player bar, visible on every view.
Scope has no placement setting of its own — it is always drawn over the cover.
Effects
Section titled “Effects”These effects apply on top of whichever mode (bars, lines, or scope) is active, and live under Settings → Visualizer → Frame. Bloom, Beat Reactivity, and CRT are global; Motion Trails and Echo are configured per mode.
Bloom Glow
Section titled “Bloom Glow”visualizer.bloom (default true) makes bright bars, peak flashes, and the neon line core bleed a soft additive halo. A brightness threshold means only the bright parts glow. visualizer.bloom_intensity (default 0.6, range 0.0–1.0) sets the strength — at 0 nothing glows even with bloom enabled.
Beat Reactivity
Section titled “Beat Reactivity”visualizer.beat_reactivity (default 1.0, range 0.0–1.0) controls how hard the effects pump on the beat and bass drops. It scales the bloom surge, the lines-mode glow flare, the bar brightness lift, and the echo swirl together. At 0.0 everything is steady and tracks loudness only; at 1.0 it punches on every kick. (The CRT beat zoom-punch is driven by the raw beat and is not affected by this setting.)
Motion Trails
Section titled “Motion Trails”Motion trails leave a fading after-image behind the waveform — a short ghost at low values, a long comet trail near 1.0. It is a flat per-frame fade; for the swirling variant use Echo. Configured per mode — visualizer.bars.trails, visualizer.lines.trails, visualizer.scope.trails — and off (0.0) by default everywhere because it noticeably changes the look.
Echo is Milkdrop-style zoom/rotate feedback: the visualizer spirals and tunnels into itself, swirling harder with the bass and beat. Near 1.0 the feedback persists strongly and effectively takes over the display. Unlike Motion Trails (a flat fade), Echo warps and rotates each fading copy. Configured per mode — visualizer.bars.echo, visualizer.lines.echo, visualizer.scope.echo. Bars and Lines default to 0.0 (off); Scope defaults to 1.0, a strong feedback swirl that takes over the ring.
CRT / Film
Section titled “CRT / Film”visualizer.crt (default 0.0, off) is a retro composite under one master amount: chromatic aberration, scanlines, vignette, film grain, and a beat zoom-punch. It is masked to the visualizer content, so it never tints the rest of the UI.
Advanced Smoothing
Section titled “Advanced Smoothing”Nokkvi provides two mutually exclusive smoothing algorithms to tailor the visualizer’s response. Both apply to bars mode only — lines mode does its own Catmull-Rom smoothing on the GPU.
Monstercat Smoothing
Section titled “Monstercat Smoothing”An exponential falloff effect that spreads energy to neighboring bars, creating a “bouncy” and connected look.
- Key:
visualizer.monstercat - Value:
0.7to10.0(higher = more spread). Values below0.7snap to0.0(disabled).
Waves Smoothing
Section titled “Waves Smoothing”Applies spline interpolation between bars to create a smooth, wave-like silhouette.
- Key:
visualizer.waves - Value:
true/false. - Intensity:
visualizer.waves_smoothing(2to16).